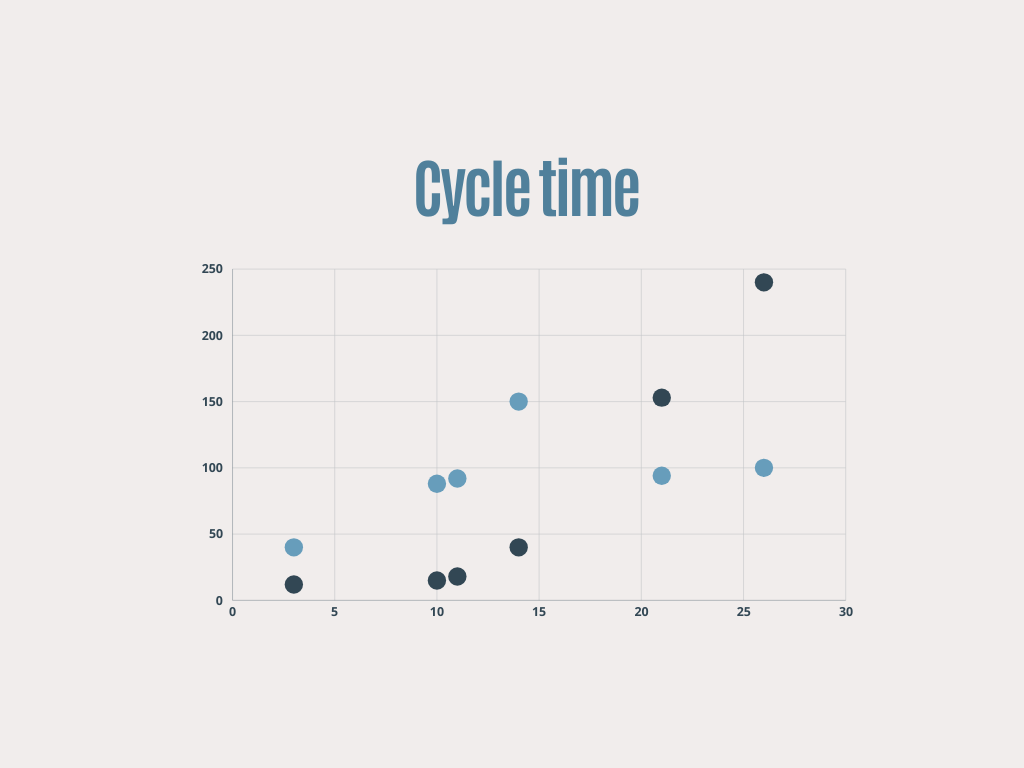
Master your team's performance: Start with understanding cycle time.
Learn how cycle time highlights different problems and what to do about it. Uncover straightforward methods for implementing the DORA Lead Time for Changes (LT) concept.
You are currently viewing a free article. Subscribe to our paid plan to receive full chapters in your mailbox, or visit the shop for downloads.
"I'm getting tired of being the only ones stepping up to finish things,” said Johannes as he and his colleague Matt headed for a coffee break. "Don't you feel like we're the only ones doing this?"
A few months back, Johannes and Matt connected at the startup where they were both employed. The enthusiasm they initially felt had begun to fade, replaced by disappointment. They finally reached the kitchen after what felt like an eternity in the daily standup meeting.
"Yeah, especially when it comes to code reviews," replied Matt.
Both colleagues agreed that when it was time for a code review, it seemed like everyone was too caught up with new tasks they had just begun.
"For me, the worst part is feeling like we're constantly busy but still don’t get work done" sighed Matt.
Cycle time represents the duration, typically measured in days, from when work begins on a ticket until it's completed.
While you have the option to examine lead time, such as in the DORA framework, I suggest that cycle time provides more comprehensive insights into team dynamics and is easier to interpret.
Cycle time isn't about how fast we work or comparing ourselves to others. It's about completing work, rather than constantly adding more to our plate. It's about making sure the team's workflow runs smoothly.
Is our collaboration effective? Are we addressing issues before they become major problems? Are we prioritizing quality? Are we accumulating too much technical debt?
While it's ambitious to have all the answers about the team's performance, we can start by examining our cycle time. It gives us valuable insights into how efficiently we're getting things done.
What data should I look at?
We will use a simple workflow of a ticket:
InProgress > Blocked > Code Review > Testing > Deployment > Done.
What data should you filter:
Select tasks. Select User stories, other tasks, and bugs, but leave out other topics like UX research, Big projects (Epics), etc.
Select statutes. Typically from InProgress until Done.
Select timeframe. Here it is fine to play around and explore historical data. However, I suggest focusing on the last two weeks for initial presentations to your team. This approach ensures relevance without overwhelming participants.
When is cycle time useful?
Reviewing the team's cycle time initiates a dialogue about the team's performance, which is always valuable. It's an exercise we should undertake regularly, even if we don't observe clear trends.
Nevertheless, analyzing patterns in the cycle time can help us identify specific scenarios or situations within the team's workflow. These patterns offer insights that can guide us in improving our processes and performance.
Scenario 1: Team members aren't collaborating and don’t have a proactive mindset.
These two elements are indeed challenging to measure directly with data. Initially, you'll likely notice conversational patterns that indicate these issues.
Are team members actively contributing to shared goals?
Are they supporting each other?
Is their primary focus on accomplishing tasks, even if it requires stepping out of their comfort zones?
Presenting data to the team can help raise awareness that something may be suboptimal. We can identify this scenario if we observe the following two patterns:
Pattern 1: The moving average is growing
If there are particular tasks within the team that we consistently avoid or if we're constantly occupied with new tasks without helping to complete existing ones, the cycle time will gradually increase over time.

This simply means our work takes longer to be completed. We're not overly concerned about how fast things are happening, but we do want to understand why this pattern is occurring.
Pattern 2: Bottlenecks in certain statuses
To see if there's a task we keep avoiding, we'll check the longest tickets and see where they spent most of their time. Is it testing? Code Review?
If the hold-up is in the "InProgress" status, it's probably because we're not breaking down our tasks effectively. But for teams that aren't very proactive, common bottlenecks might be Code Review, Testing, and deployment.
We want to know why our tasks are getting stuck, waiting for someone to step up and help out.
What actions should be taken?
If we identify a clear bottleneck, then the discussion has a defined focus.
What's the problem?
How do we want things to be?
What steps can we take to improve the situation?
During the retrospective, we can present this data to steer the conversation towards this topic.
Sometimes, even without a clear pattern, the cycle time continues to increase. This suggests that the team is taking on too much work and not focusing enough on completing tasks. In such cases, I recommend three strategies:
Set limits on the number of tickets allowed in each status.
Focus on pulling in only as many story points as were achieved in the last sprint (for Scrum teams).
Shift the focus of the daily standup to ask: "What can we finish today?"
Limiting work in progress creates situations where team members have downtime and are available to assist others. With the right mindset, this approach can quickly optimize our cycle time.
Once we've optimized the cycle time, we can gradually increase the number of tickets to find the right balance between cycle time and throughput.
Upgrade to the paid subscription to receive in your mailbox:
Additional scenarios and strategies in detail.
A guide on effectively analyzing cycle time within your team, including when and how to do so.
What is a good cycle time for your team?
Full detail guides about other performance metrics.


