Identifying Underperforming Teams
Using a statistical approach to situational awareness, directors and senior managers can identify key areas to focus on.
Situational Awareness
Foreword by Denis Čahuk
What is going on in your teams? Do you need to intervene?
These are complex questions. There is no clear, universal answer that we know of as a good predictor of high performance. However, it is quite trivial to spot for evidence of low performance.
These could be any number of:
Blocked work, frequent hand-offs
Low quality documentation, resulting in more needless (endless) meetings
Lack of psychological safety, causing the best ideas to remain unvoiced
Measuring individual performance without clear high-quality standards
The DORA Core1 capabilities are a great starting point for leaders and managers to enhance situational awareness and workflow. Using these or your own definitions of high-performing teams, you can create valuable questionnaires.
Analyzing data from these questionnaires with statistical methods can reveal more insights than expected. This article will show you how to objectively identify underperforming teams using proven scientific methods.
Here is what we found out for our teams
Our initial focus is on a simple finding: identifying whether there are teams that underperform compared to a baseline. We will streamline this method to determine which teams are significantly below expectations.
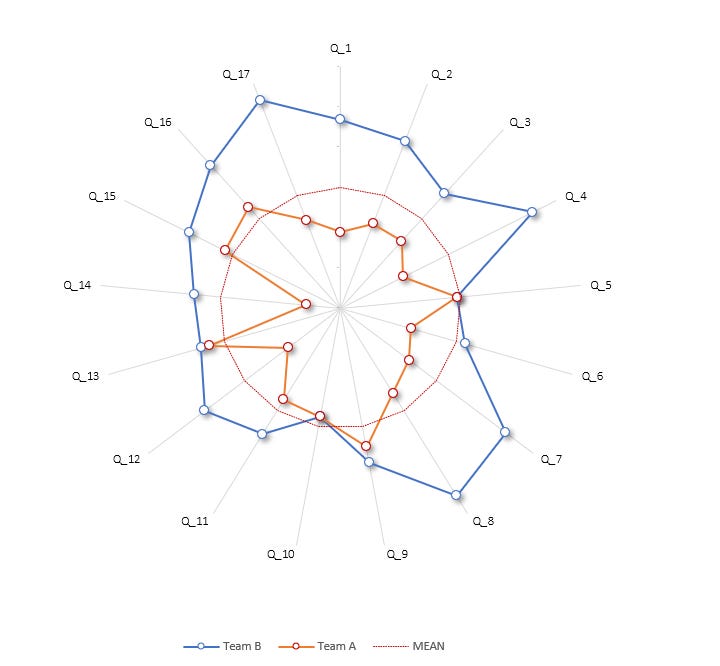
After collecting the data in one of the departments I work with, and performing our analysis, we found significant differences between the teams, which we illustrated in a simple graphic. Notably, we discovered one team that is underperforming.

The graphic compares two teams' performance to a baseline, calculated from a 17-question survey. Each dot indicates deviation from the baseline, illustrating performance disparities clearly.
This visual representation makes it easy to interpret the data analysis and helps make quick decisions on where to focus attention.
The statistics behind these findings, explained below, can be easily integrated into a regular process for assessing the department's health. This provides leadership with an objective way to decide where to focus.
How We Did the Analysis
We first created a questionnaire based on leadership's definition of high-performing teams. The concept is that teams with high scores will perform better than those with lower scores.
To avoid biases and ensure the questionnaire represents our expectations, there are a few important factors:
The scale of the questions and how the baseline is created.
The phrasing of the questions, as it minimizes bias and increases objectivity.
Contrasting the results with already-known observations.
Strategy for administering the questionnaire to maximize the response rate.
These factors contribute to data quality, though some level of noise and bias in the answers is still assumed.
The statistical method we used is a hypothesis test, where we define a comparison we want to analyze and get a mathematically proven answer on whether the differences are significant.
The hypothesis tests show a lack of consistency across teams in our department. Further tests will be conducted to find out which teams are below the baseline.
Using this method, you can ask multiple questions:
Do we have consistent performance in our department? Hypothesis test between all teams and a baseline value.
Is a particular team performing significantly lower or higher than the rest? Hypothesis test between that team's data and the baseline.
By creating a stream of hypothesis tests for all the teams compared to a baseline, you can objectively determine if each team is underperforming.
Footnotes
1 Dora Core capabilities — https://dora.dev/research/


